Amidst the recent flurry of discussions about research assessment strategies came Neil Saunders and posted his analysis of the number of retractions indexed in PubMed. At the same time, Giorgio Gilestro weighed in with his opinion on what needed to change about the way we do science. One of his arguments was that tenure had served its purpose and needed to go. The discussion about tenure is an old one and comes back every 20 or so years. And yet, tenure is still around. Or is it?
In previous posts I've argued that increased pressure on scientists will increase the incentives for skipped controls, data picking, fabrication and other scientific misconduct. It's just a completely different thing if the result of your next experiment could decide if you will have food on the table or not, compared to when it's just about your pet hypothesis and your livelyhood isn't threatened. Today, I'd like to juxtapose the development of the tenure track position (in the US, that is) to the number of retractions over the years. The data for the tenure-track positions come from two different sources, one spanning the late 1970s to the early 1990s and one spanning the ten years from 1997-2007:
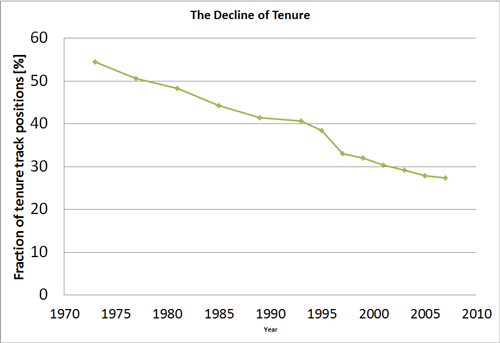
Now compare the graph above with this graph from Neil, which also starts in the 1970s:
Now clearly, this isn't a one-to-one correlation. there is obviously a nonlinear relationship between the development of the retractions compared to the decline in tenure. It's a linear decline in tenure, whereas the increase in retractions clearly isn't. But then again, perception probably isn't a linear process anyway, so if the perceived pressure on scientists is driving misconduct, once the tenured psoition drops below a certain threshold, the number of retractions will necessarily go up. If this interpreation holds, we passed this threshold around 1990, or at a percentage of tenure-track positions of about 40%.
Intriguing correlation, but is there causation?
Posted on Thursday 02 December 2010 - 19:31:15 comment: 0
{TAGS}
{TAGS}
You must be logged in to make comments on this site - please log in, or if you are not registered click here to signup
Render time: 0.0610 sec, 0.0045 of that for queries.